
I’ve raved about Edward Tufte and his minimalistic approach to data visualization plenty of times before … I just found there is an R package implementing some of his plot designs, see
http://motioninsocial.com/tufte/
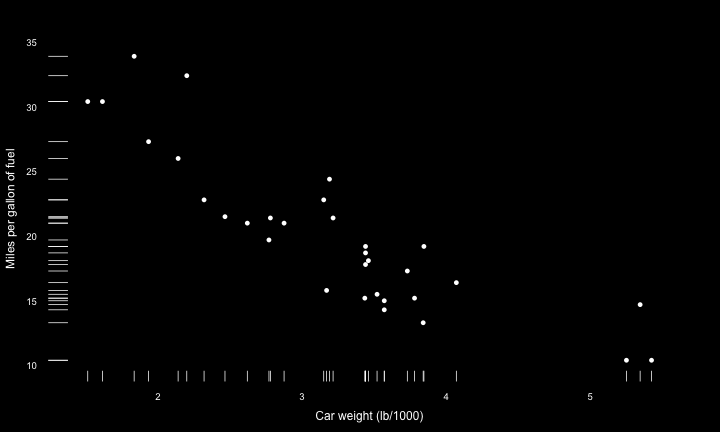
I especially like the scatter plots with marginal densities indicated by “stripes” on the axes,
Of course I would like this in Mathematica instead … but better than nothing I guess ;-)