In the LC-MS data we’ve gathered over the past year, there is frequently strong peaks for N-acetylated amino acids, and there is clear incorporation of labeled acetate from U-13C-glucose, showing that these species are endogenously synthesized (over 48h incubations, mostly). It’s intriguing because, as far as I can tell, there is no known mechanism for N-acetylation of free amino acids in humans.
What about protein acetylation? Free acetylated amino acids could be a product of breakdown of acetylated residues in protein, but the well known protein acetylations (lysine, for example) happens on amino acid side chains, not on the amine (alpha) nitrogen which is part of the peptide bond.
But it turns out that proteins are in fact often acetylated on their N- terminal amino acid. This phenomenon was discovered 40 years ago, but what the heck it’s good for is still being debated. So maybe this explains the N-acetyl amino acids we often see. Or maybe it’s something different entirely …
We noted while “pinning metabolites” that allantoin was present in the mass spec data from UCSD. This metabolite is not supposed to be present in humans; it is a breakdown product of purines in some animals, but in humans and other primates, the producing enzyme does not exist, and instead, uric acid (urate) is the final product of purine catabolism. Or at least so I thought.
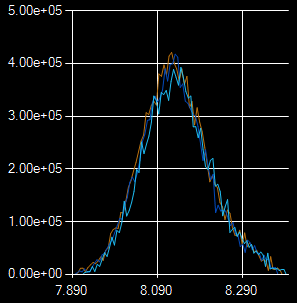
Allantoin peak in HeLa cells (Irena). UCSD QExactive, pHILIC column, (+) mode.
It turns out that urate can spontaneously oxidize to form allantoin, and some think that this is an indicator of oxidative stress (whatever that means in this context). But there are also concerns that this is an artefact of sample handling conditions. It would be interesting to see if cells with labeled purines produce labeled allantoin …
This new Cell family journal will cater to the systems biology crowd. The first issue includes gems like network analyses of transcriptional regulation, search strategies for large biological data sets, and how to remote control mice :)
If you haven’t seen it already, check out BioNumbers ! It’s a database of all sorts of things in biology that are measurable and can be expressed in numbers — the size of a cell, the length of a chromosome, the speed of an enzyme … It was started by Ron Milo when he was at Harvard (now at the Weizmann Institute).
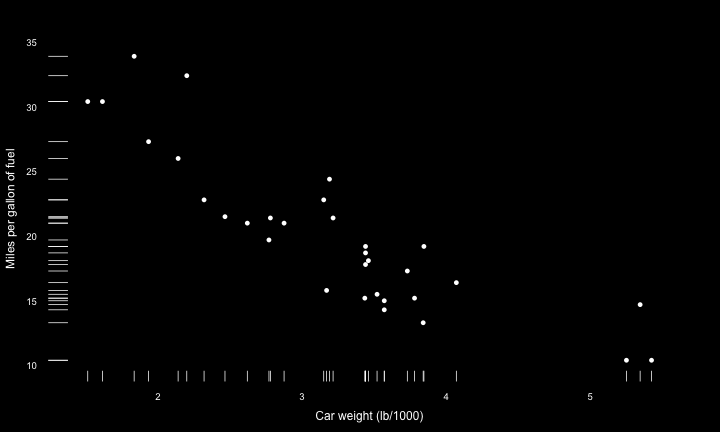
I’ve raved about Edward Tufte and his minimalistic approach to data visualization plenty of times before … I just found there is an R package implementing some of his plot designs, see
 This new Cell family journal will cater to the systems biology crowd. The first issue includes gems like network analyses of transcriptional regulation, search strategies for large biological data sets, and how to remote control mice :)